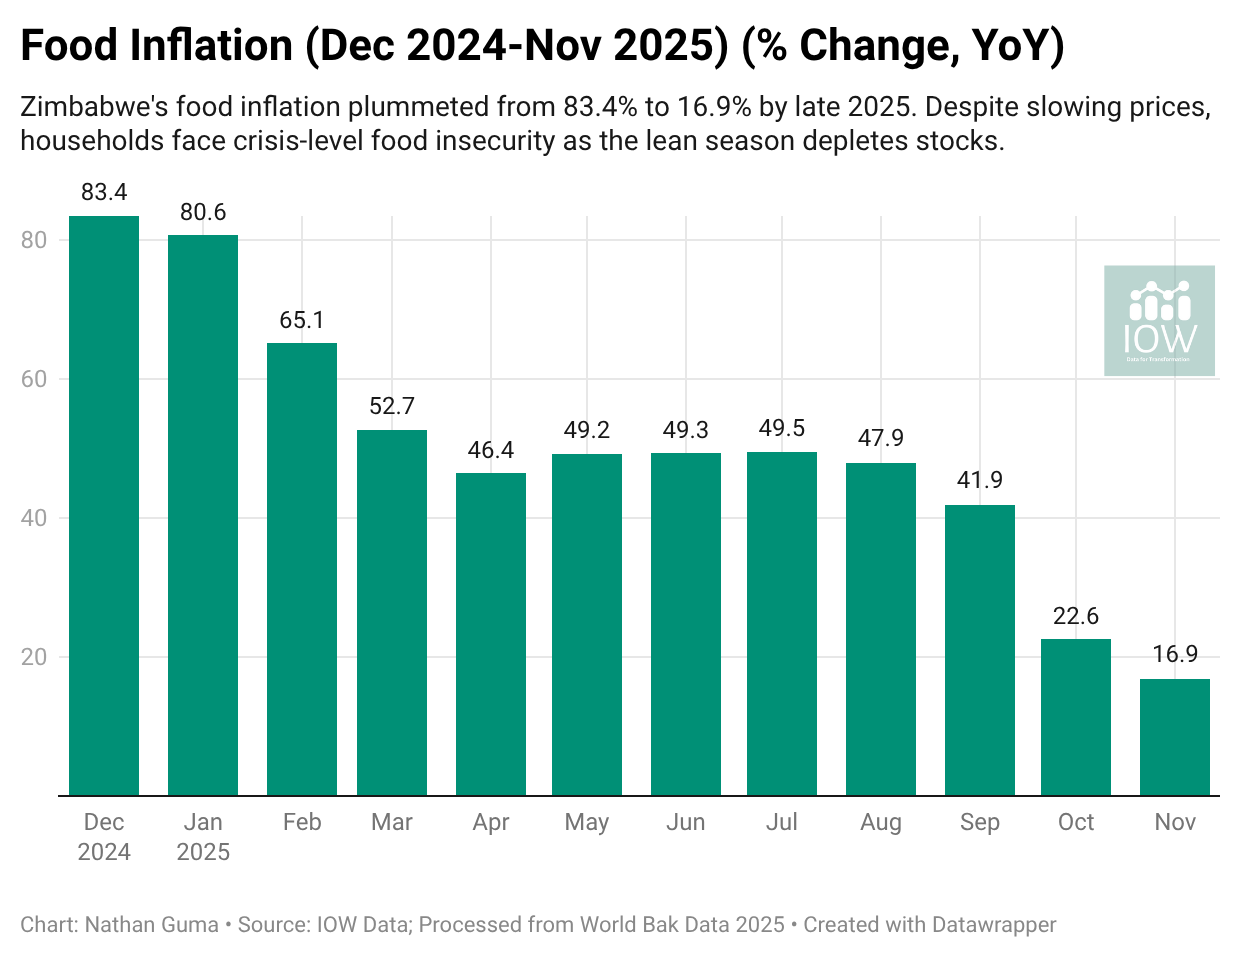
WORLD Bank data trends show that Zimbabwe’s annual food inflation rate has recorded a significant decline, falling to 16.9% in November 2025.
However, this statistical relief is likely to be affected by the onset of the lean season, with crisis conditions emerging in some provinces.
According to the World Bank’s Food Security Update, food inflation fell from 83.4% recorded in December 2024 to 16.9% in November 2025.
Despite this easing of nominal price increases, the country remains under inflationary pressures that continue to erode the purchasing power of poor households.
The report also indicates that the downward trend in inflation has been consistent throughout the year, with the rate dropping from 41.9 percent in September to 22.6% in October.
Crisis
However, this statistical relief is tempered by the onset of the lean season, which has seen Crisis (IPC Phase 3) conditions emerge in provinces such as Masvingo and Matabeleland.
IPC Phase 3 (Crisis) occurs when households face significant food gaps or are forced to deplete essential assets to survive, resulting in high levels of malnutrition and the need for urgent intervention.
According to the report, farmers’ food stocks in these areas are currently depleted, while maize grain supplies are constrained by low flows from surplus to deficit areas.
While favourable rainfall in November has supported land preparation and pasture regeneration, the high cost of crop inputs remains a major barrier for low-income households.
Consequently, domestic prices are expected to remain above seasonal averages, complicating access to nutrition even as the official inflation rate cools.
Colour codes
The data also shows that Zimbabwe’s food inflation has remained high. From December 2024 to September 2025, it was in the purple zone.
For nominal food inflation, this indicates price increases of 30 percent or higher. For real food inflation (food inflation minus overall inflation), it represents an increase of more than 5 percent.
In October and November, it moved into the red zone.
This colour signifies high inflationary pressure, indicating a nominal year-on-year price increase of between 5 and 30%. In terms of real food inflation, red represents an increase of 2 to 5%.
The yellow zone, on the other hand, comprises countries with lower food inflation.
It represents a nominal price increase of between 2 and 5%. For real food inflation, yellow signifies a year-on-year increase of 0 to 2%.
What Next?
According to the report, to ensure global food security, nations must strengthen sustainable agriculture, restore degraded lands, combine regulations with incentives, and apply nuanced, coordinated multi-sector nutrition interventions to build resilient global agrifood systems. – IOW Data.